Free Rental Property Analysis Spreadsheet
Download the free Excel workbook for cash flow, upfront costs and mortgage equity, with editable assumptions, 30-year projections and a monthly loan schedule.
Get the free spreadsheet
No account needed.
Prefer Google Sheets? Open our original Google Sheets template and choose File → Make a copy.
See the Excel workbook
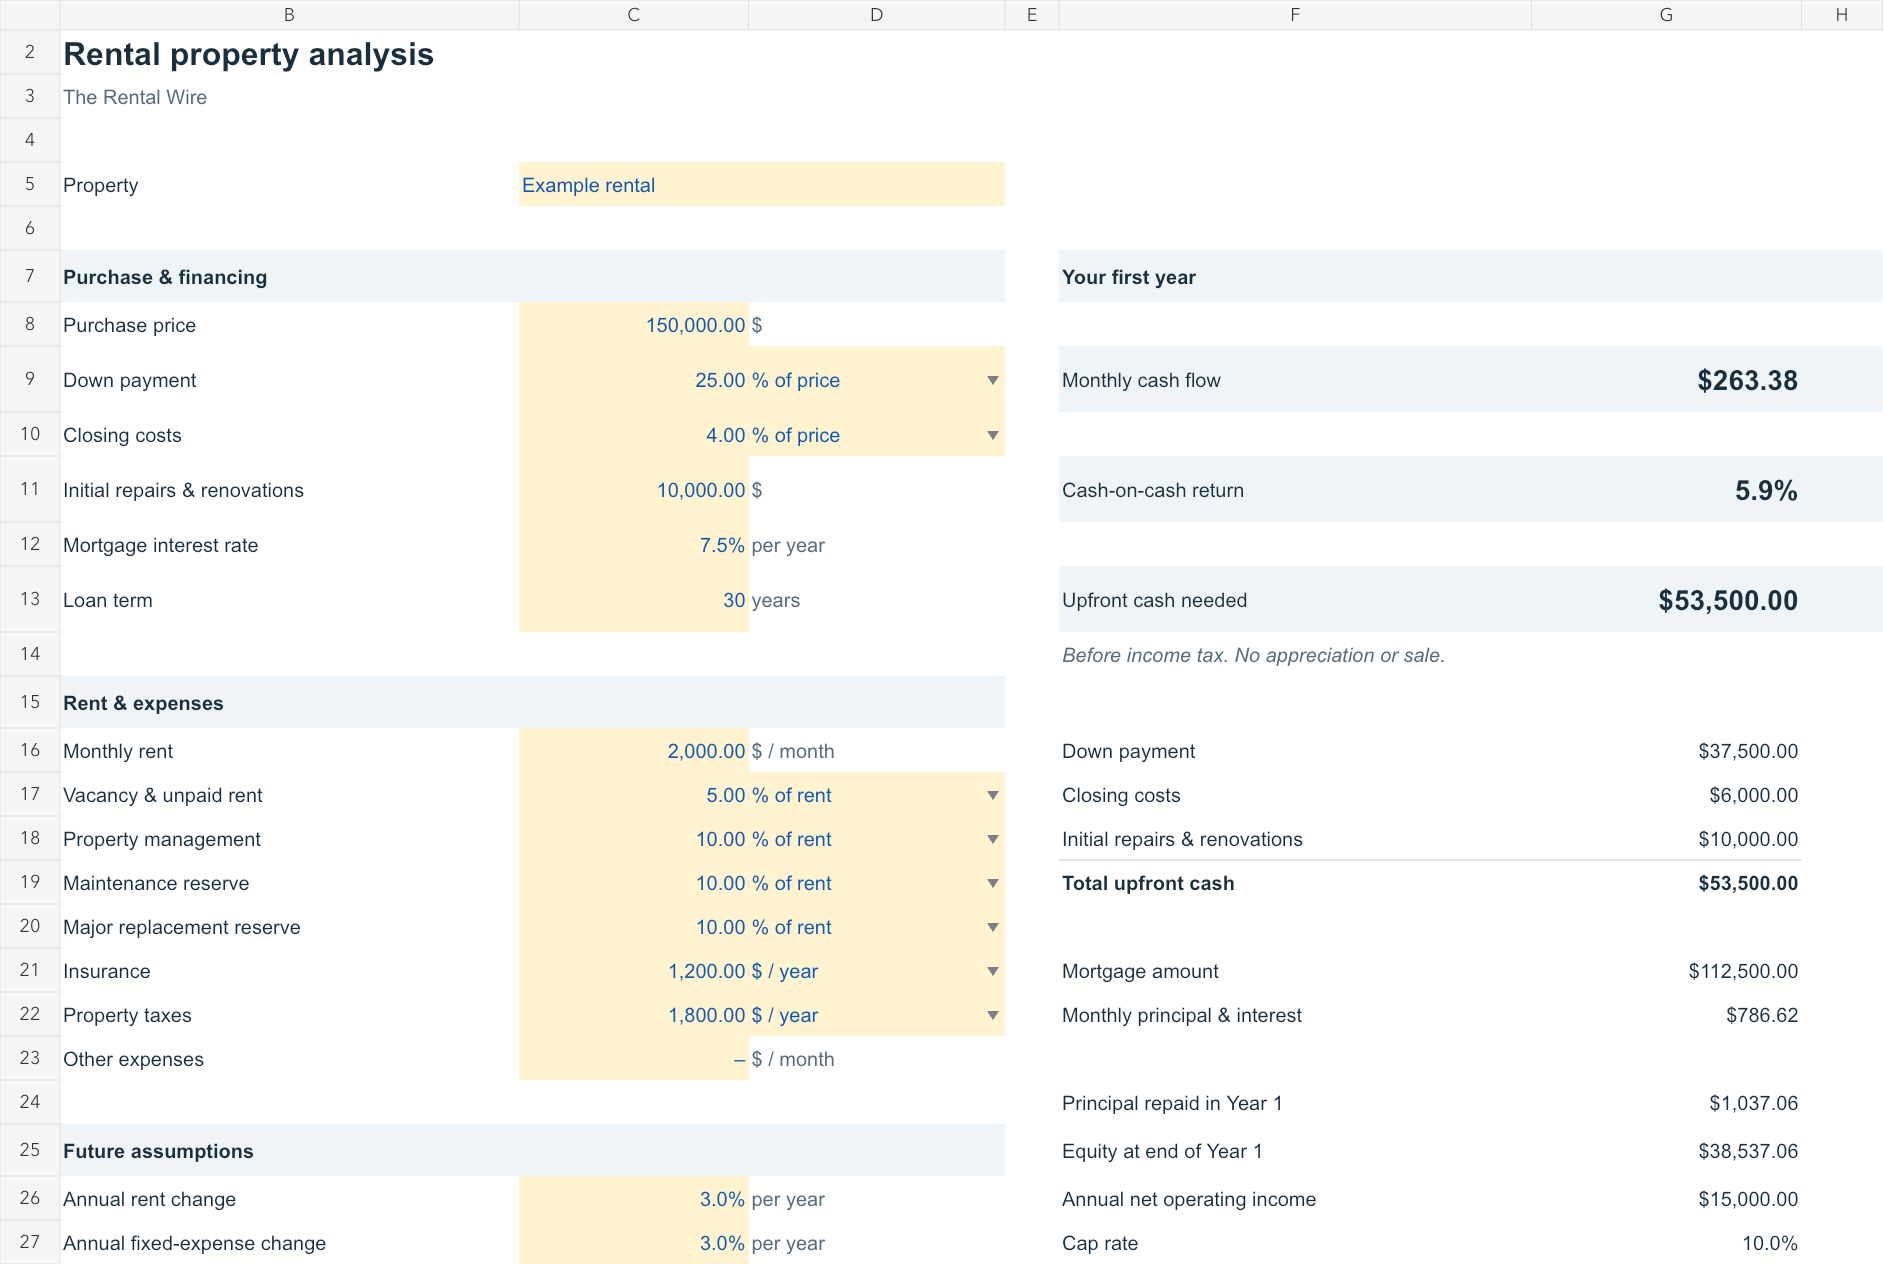
Rent and expenses can grow at different rates. Cash flow and mortgage paydown are shown separately. Results exclude income tax, appreciation and sale costs.
Already working in our spreadsheet?
Bring your numbers into the online property analyzer without entering them again.
Current Rental Wire Excel template only. Your file stays on this device.
Inputs to gather
Gather the purchase price, financing quote, expected rent, tax bill, insurance quote and repair estimates. These tools can help with the inputs: management fees, routine maintenance and major replacement reserves.
Find a price that meets your return target with the maximum offer price calculator, or compare a cash purchase with a mortgage. Both carry your assumptions into the full analyzer.
Check rent benchmarks across 50 markets and their ZIP codes, and use the itemized rehab budget to total upfront work. For an occupied property, organize the seller’s records with a rent roll and 12-month income statement.
How to analyze a rental property
Purchase costs
For a financed purchase, add the down payment and closing costs. For an all-cash purchase, use the full price plus closing costs. If you borrow, include the mortgage payment in monthly expenses.
Add the work needed before renting
Include initial renovations, repairs, appliances and cleaning in your upfront cash. Keep these separate from the maintenance and replacement costs you expect during ownership.
Estimate monthly rent
Compare nearby rentals with similar size, condition and amenities. Listings on sites such as Zillow can help; check what is included in the rent. HUD’s 50th-percentile rent data is another reference, organized by area and bedroom count. HUD gross-rent benchmarks include tenant-paid utilities, so they are not directly equivalent to asking rents.
Test a lower-rent case too. For example, if comparable rentals ask $2,000 a month, a 5% reduction gives you a $1,900 scenario to compare.
Estimate monthly expenses
Replace the spreadsheet’s examples with estimates for your property:
- Mortgage principal and interest, if financed
- Property taxes and insurance
- Property management, if used
- Vacancy and unpaid rent
- Routine maintenance and repairs
- A separate reserve for major replacements
Compare cash flow and equity
- Cash-on-cash return: annual cash flow divided by upfront cash. A $100,000 purchase with 20% down and $10,000 in repairs needs $30,000, assuming no other upfront costs. At $150 monthly cash flow after all expenses and the mortgage, the return is ($150 × 12) ÷ $30,000 = 6%. See the cash-on-cash return guide.
- Mortgage principal repaid: the reduction in your loan balance during the year. It adds equity but is not spendable cash. Appreciation is excluded.
- Cash flow plus principal paydown: annual cash flow and principal paid down, divided by original upfront cash. This excludes appreciation, income taxes and sale costs, so it is not a complete holding-period return.
The rental property ROI guide explains these measures with a full example.
Check formulas if you change the workbook layout or add rows.
Try the free property analyzer to adjust assumptions and see cash flow and equity projections in your browser. No account needed.